As an engineering student working on a co-op assignment and internship, I was assigned a less-than-thrilling task. I monitored a machine to observe any errors it generated for several hours at a time. While I was happy to do it, this assignment was incredibly dull, and anyone who didn’t know what I was doing would certainly question my mental state.
While constant observation was an easy and appropriate solution for that particular “data logging” scenario, the good news is that we can often track errors automatically. Modern automated manufacturing equipment typically has this type of capability built in, but for a more general, cost-effective, and automatic logging tool, Arduino boards can be a great solution.
Arduino Data Logging Shield
The setup I’ll describe here uses an Arduino Uno along with the excellent Adafruit data logging shield. Input is via a DHT11 temperature/humidity sensor module, but we could easily modify the hardware and code to accommodate any digital input. We could also adapt the code to other types of dev boards, though you’d need to supply an SD card adapter.
Items Needed:
- Adafruit Data Logging Shield
- DHT11 module
- CR1220 3V battery
- SD card
Arduino Data Logger: Hardware Assembly

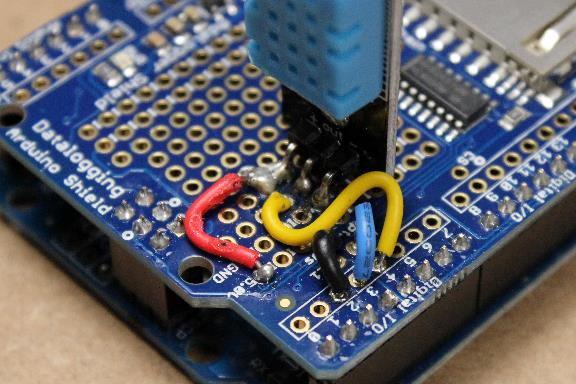
Image: Jeremy S. Cook
Follow these steps to set up your data logging device.
1. Solder together the data logging shield with the included male headers, using the Arduino Uno as a jig as needed.
2. Solder the DHT11 module’s + and - pins to ground and +5V on the prototyping area of the shield.
3. Attach the signal pin to the Arduino digital pin 4.
4. Wire L1 to Arduino pin 2 and L2 to pin 3 on the shield. These are technically optional, but they provide visual feedback as your logger interacts with the SD card.
4. Plug the shield in and insert the RTC battery.
RTC Arduino Code
The shield’s RTC module allows you to timestamp each piece of logged information. While it will run for years on a single battery, even if the Arduino is reprogrammed, the user needs to set it initially. The newest version of this shield uses a PCF8523 I2C RTC module. It’s wired into the Arduino’s analog pins 4 and 5, meaning that you only have four analog inputs to work with.
Follow these steps to program your Arduino device.
1. Obtain the RTClib by Adafruit, available on this GitHub repository.
2. Open the pcf8523 example and use it to program your RTC module.
3. Verify that the time is correct—it’s set based on your computer’s clock when compiled—using the serial monitor. This module allows you to timestamp information, and while it takes up analog input 4 and 5, the tradeoff seems well worth it.
The hardware setup is now complete.
The code I used for this experiment is available here on GitHub, and it tracks temperature and humidity with timestamps in a few different formats. The first “millis” column indicates how much time has elapsed since the Arduino powered on, while the second column indicates “unixtime”—seconds since January 1, 1970. The third column notes the time and date in a human-readable format. This code is based in part on this temperature/light logger, which you may want to explore depending on your project’s needs.
Arduino Temperature and Humidity Data Logger

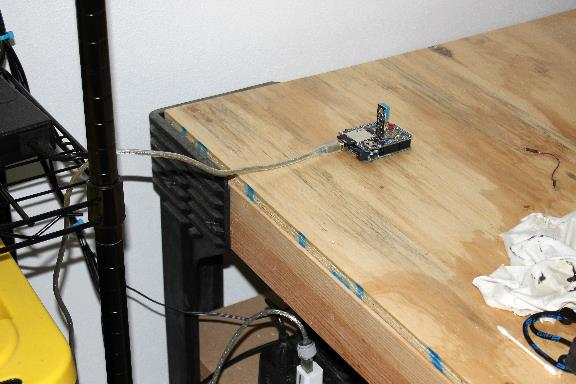
Image: Jeremy S. Cook
To test the device’s logging capabilities, I placed the Arduino data logger in my garage, which I’d augmented with insulation on the door some time ago. While I don’t have any data on the space before the insulation, I thought it would be interesting to see just how temperature changed inside throughout a day.
I set the logger up to take readings every 10 seconds. Over 24 hours, starting at 10:11 a.m. on January 24, the logger would produce 8640 data points. Ideally, you should set your data logger up to record the appropriate data beforehand, but in my case, I opened the CSV file with LibreOffice, an excellent open source Office alternative. The logger produced 8706 rows of data when I extracted it at 10:21 a.m. the next day.
To get a nice graph, I picked out one reading per hour using the following offset function shown in the Excel file contained in the project’s GitHub repository:
[OFFSET(A$2,(ROW()-2*360,0)]

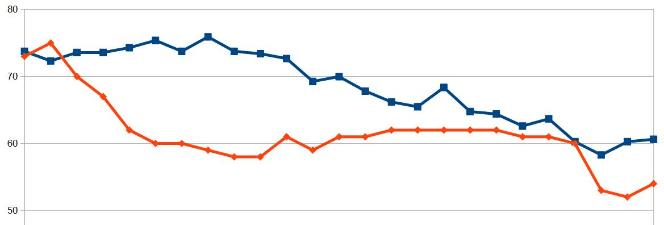
Temperature represented by blue, relative humidity in red. A “cold” January day on the Gulf Coast of Florida. Image: Jeremy S. Cook
I could do much more with this graph, but you may notice that the temperature (represented in blue) stays relatively stable for the first seven hours. Once it hits around 5:00 p.m., the temperature starts dropping through the night. The minimum temperature reported on the graph is 58 degrees—at 8:11 a.m. on January 25—though looking more closely at the data with a MIN function in the data itself, the garage temperature dropped to just under 54 degrees at 8:57 a.m. This time coincides with when my wife and kids would be leaving for school, exposing our garage to Florida’s famously harsh January winter weather.
According to Weather Underground, the minimum temperature for the morning of January 25 in my location was 45 degrees, so it appears that my insulation is at least marginally effective. There is a bit of fluctuation, so if I were to go even further, I could break it down several different ways.
While tracking your house’s temperature and humidity status is fun, this kind of graphical tracking could be extremely powerful in an industrial or business environment. You could use data logging to definitively show that you’ve made improvements in X, Y, Z process, or where to focus your efforts in the future.


